Evaporate $2 Trillion, U.S. Stocks See Worst Start in 4 Years, Why is the Market Bearish?
At the close of the U.S. stock market last weekend, seven stocks saw all their year-to-date gains wiped out, with none spared. According to Yahoo Finance data, Tesla is down 26.4% YTD, Microsoft down 15%, Meta down 15.2%, NVIDIA down 10%, Amazon down 9.5%, Google down 9%, Apple down 2%. Looking at broad market data, the S&P 500 has seen five consecutive weeks of decline, hitting a seven-month low, with a YTD cumulative decrease of 5.1%. The Dow Jones entered a pullback territory on that day. This marks the longest losing streak of 2022 so far.
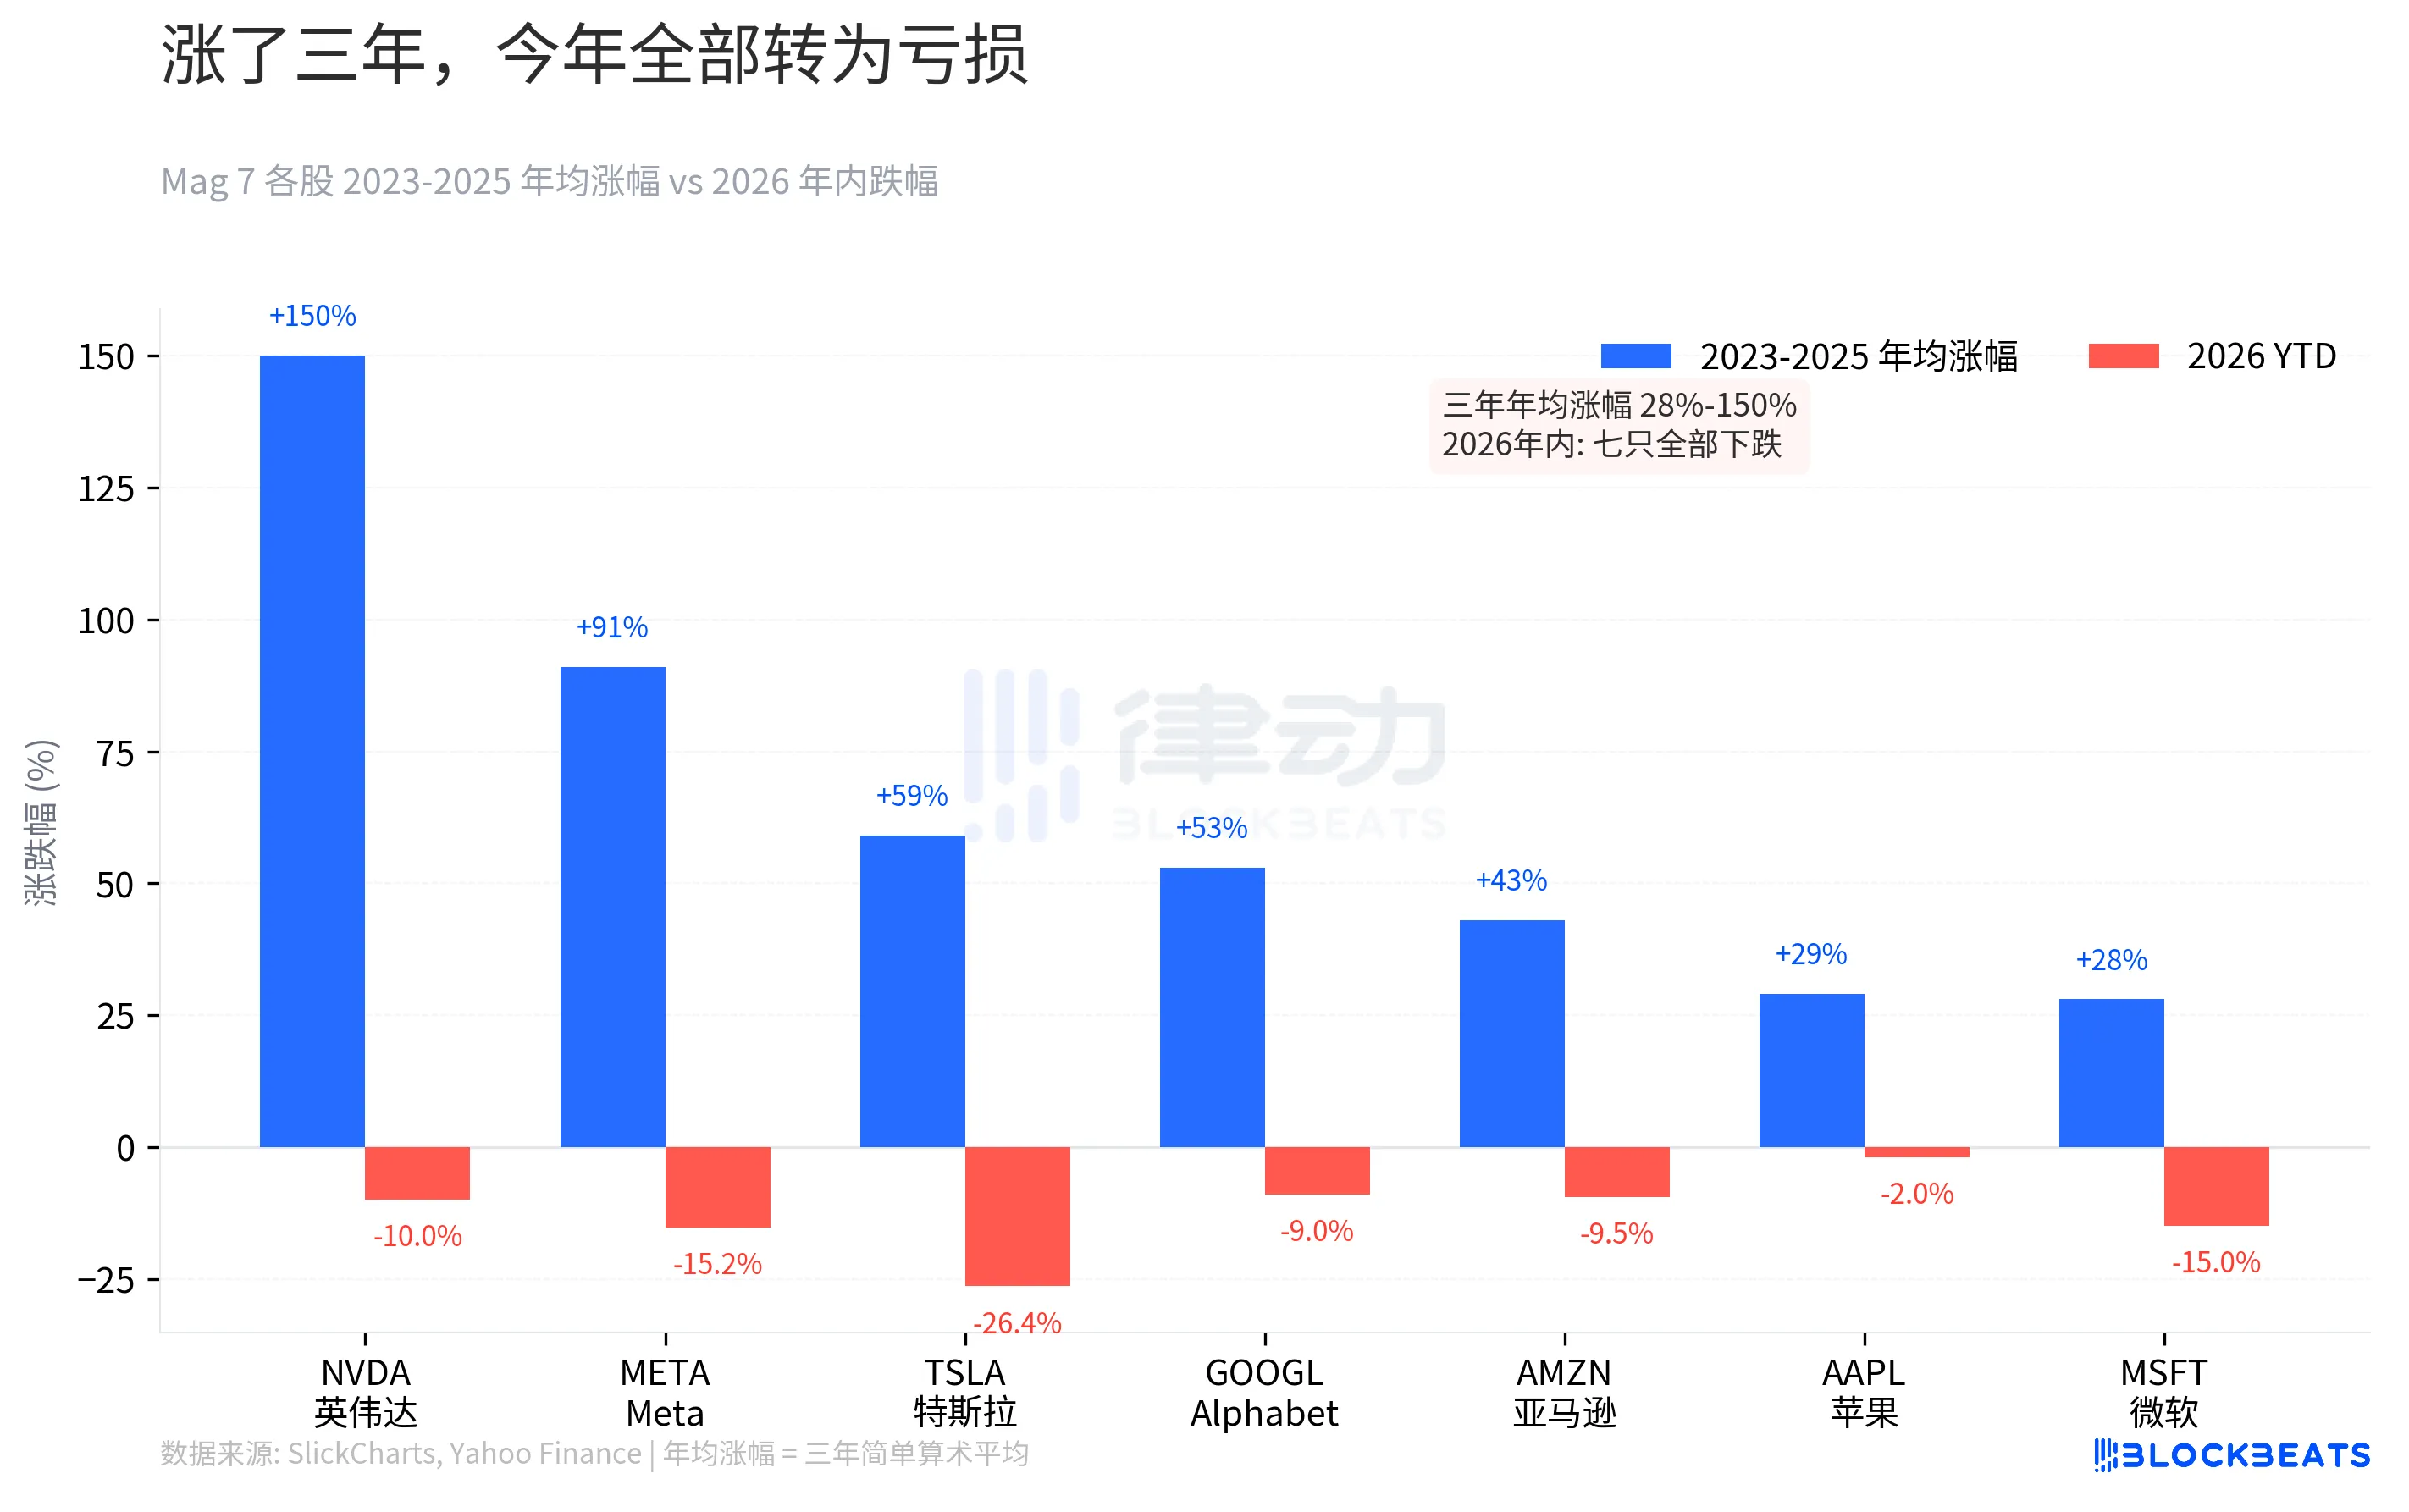
NVIDIA, which was up 239% in 2023, is now down 10% YTD. While this may seem mild, if you bought at the peak in October 2025, you would actually be down 21.2%. Meta, up 194% in 2023, is now down 15.2% from its peak. The faith accumulated during the three-year bull market has been gradually eroded in three months.
The returns in 2024 and 2025 have decelerated, from 107% to 64% to 23%. Growth has slowed, but valuations have not adjusted accordingly. When the music stopped, the risk premium ignored over the past three years came back all at once.
Rate Hike Expectation Reversal: From Single Digits to 52% in Just Three Months
The stock price decline is just a consequence. The real reversal is in interest rate expectations.
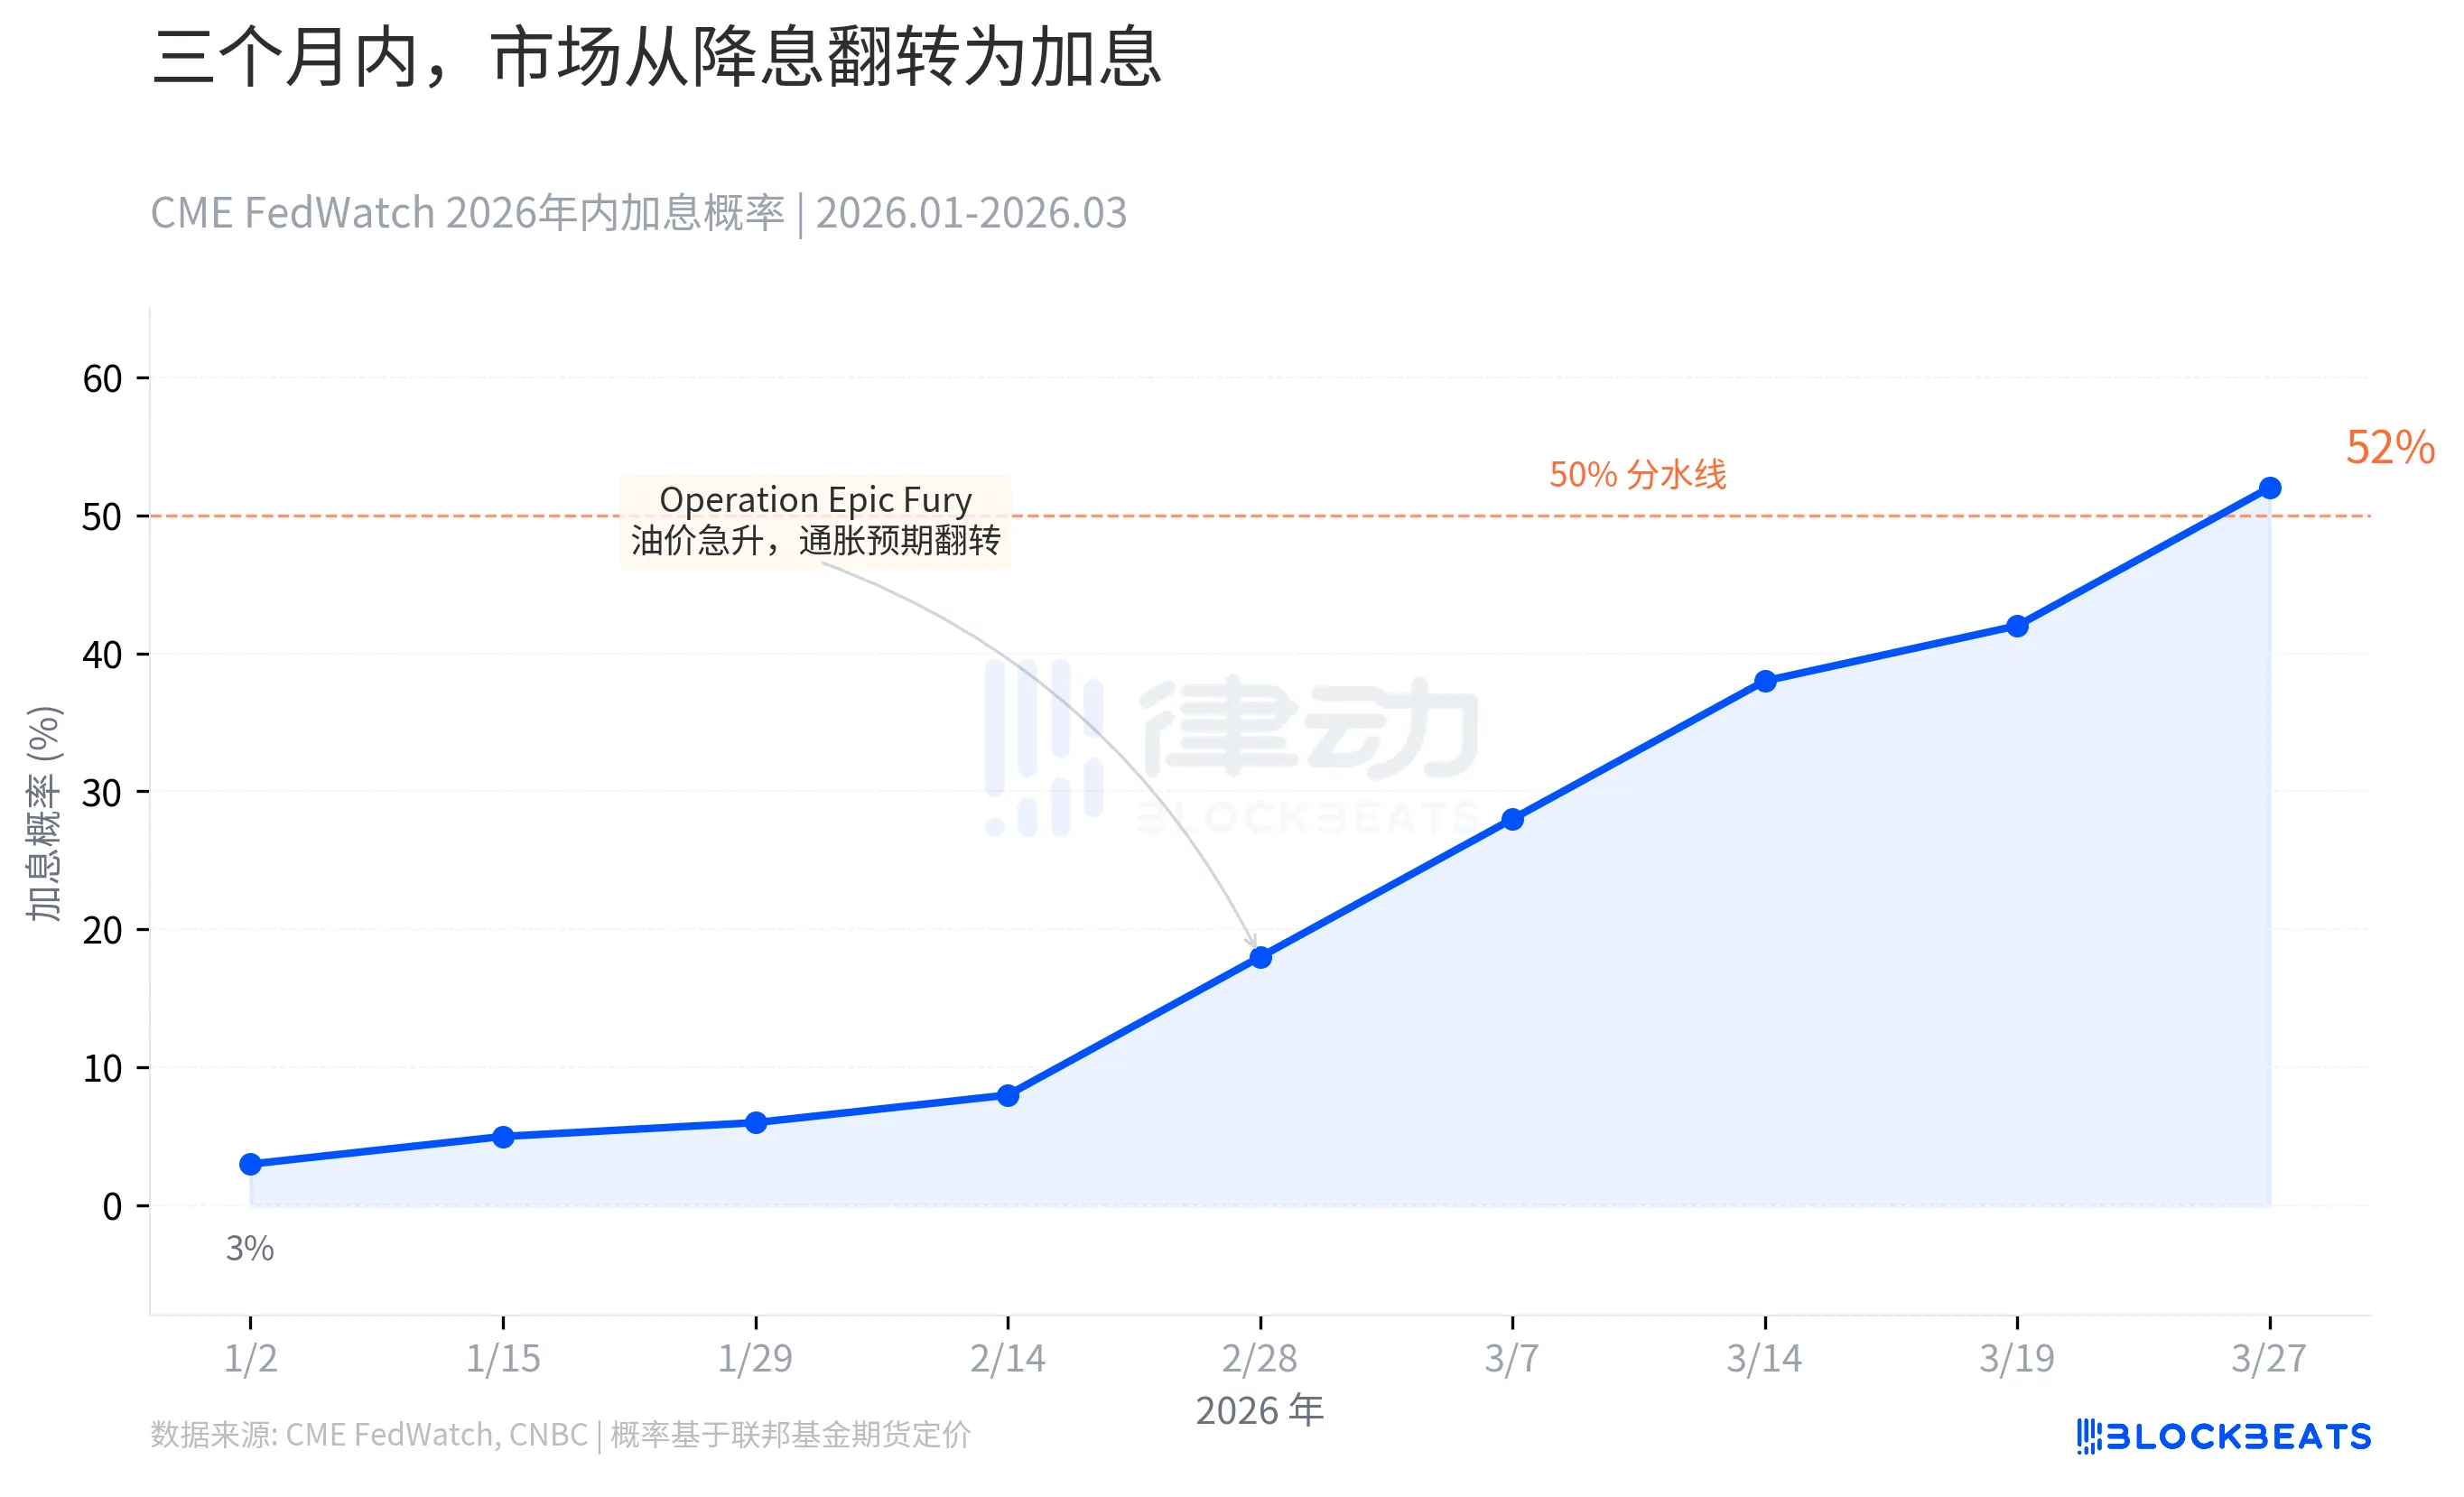
According to CME FedWatch data, in early January 2026, the market was still pricing in rate cuts, with the probability of a rate hike YTD at less than 3%. The consensus at the end of 2025 was that the Fed would continue cutting rates in 2026.
The turning point began on February 28th. The "Operation Epic Fury" triggered an escalation in the situation in the Strait of Hormuz, a chokepoint that carries 20% of global oil shipments, came under direct threat. Brent crude closed at $112.57 on March 27th, up 45% YTD. Rising oil prices fueled inflation expectations, which in turn directly reshaped rate pricing.
On March 27th, the CME futures market priced in a YTD rate hike probability exceeding 50%, reaching 52%. This marks the first time since early 2023 that the market has shifted from an "rate cut expectation" to a "rate hike expectation." According to the Atlanta Fed's Market Probability Tracker data, the probability of a 25 basis point rate hike has reached 19.8%.
From nearly zero to over half in less than three months. At the beginning of the year, there was still discussion about cutting interest rates several times, but now the discussion is about whether to raise rates.
Microsoft Drops the Most, Not Tesla
Your intuition would tell you that Tesla should be the hardest hit in the Mag 7. It has the biggest fluctuations and the most controversies. But the data presents a different reality.
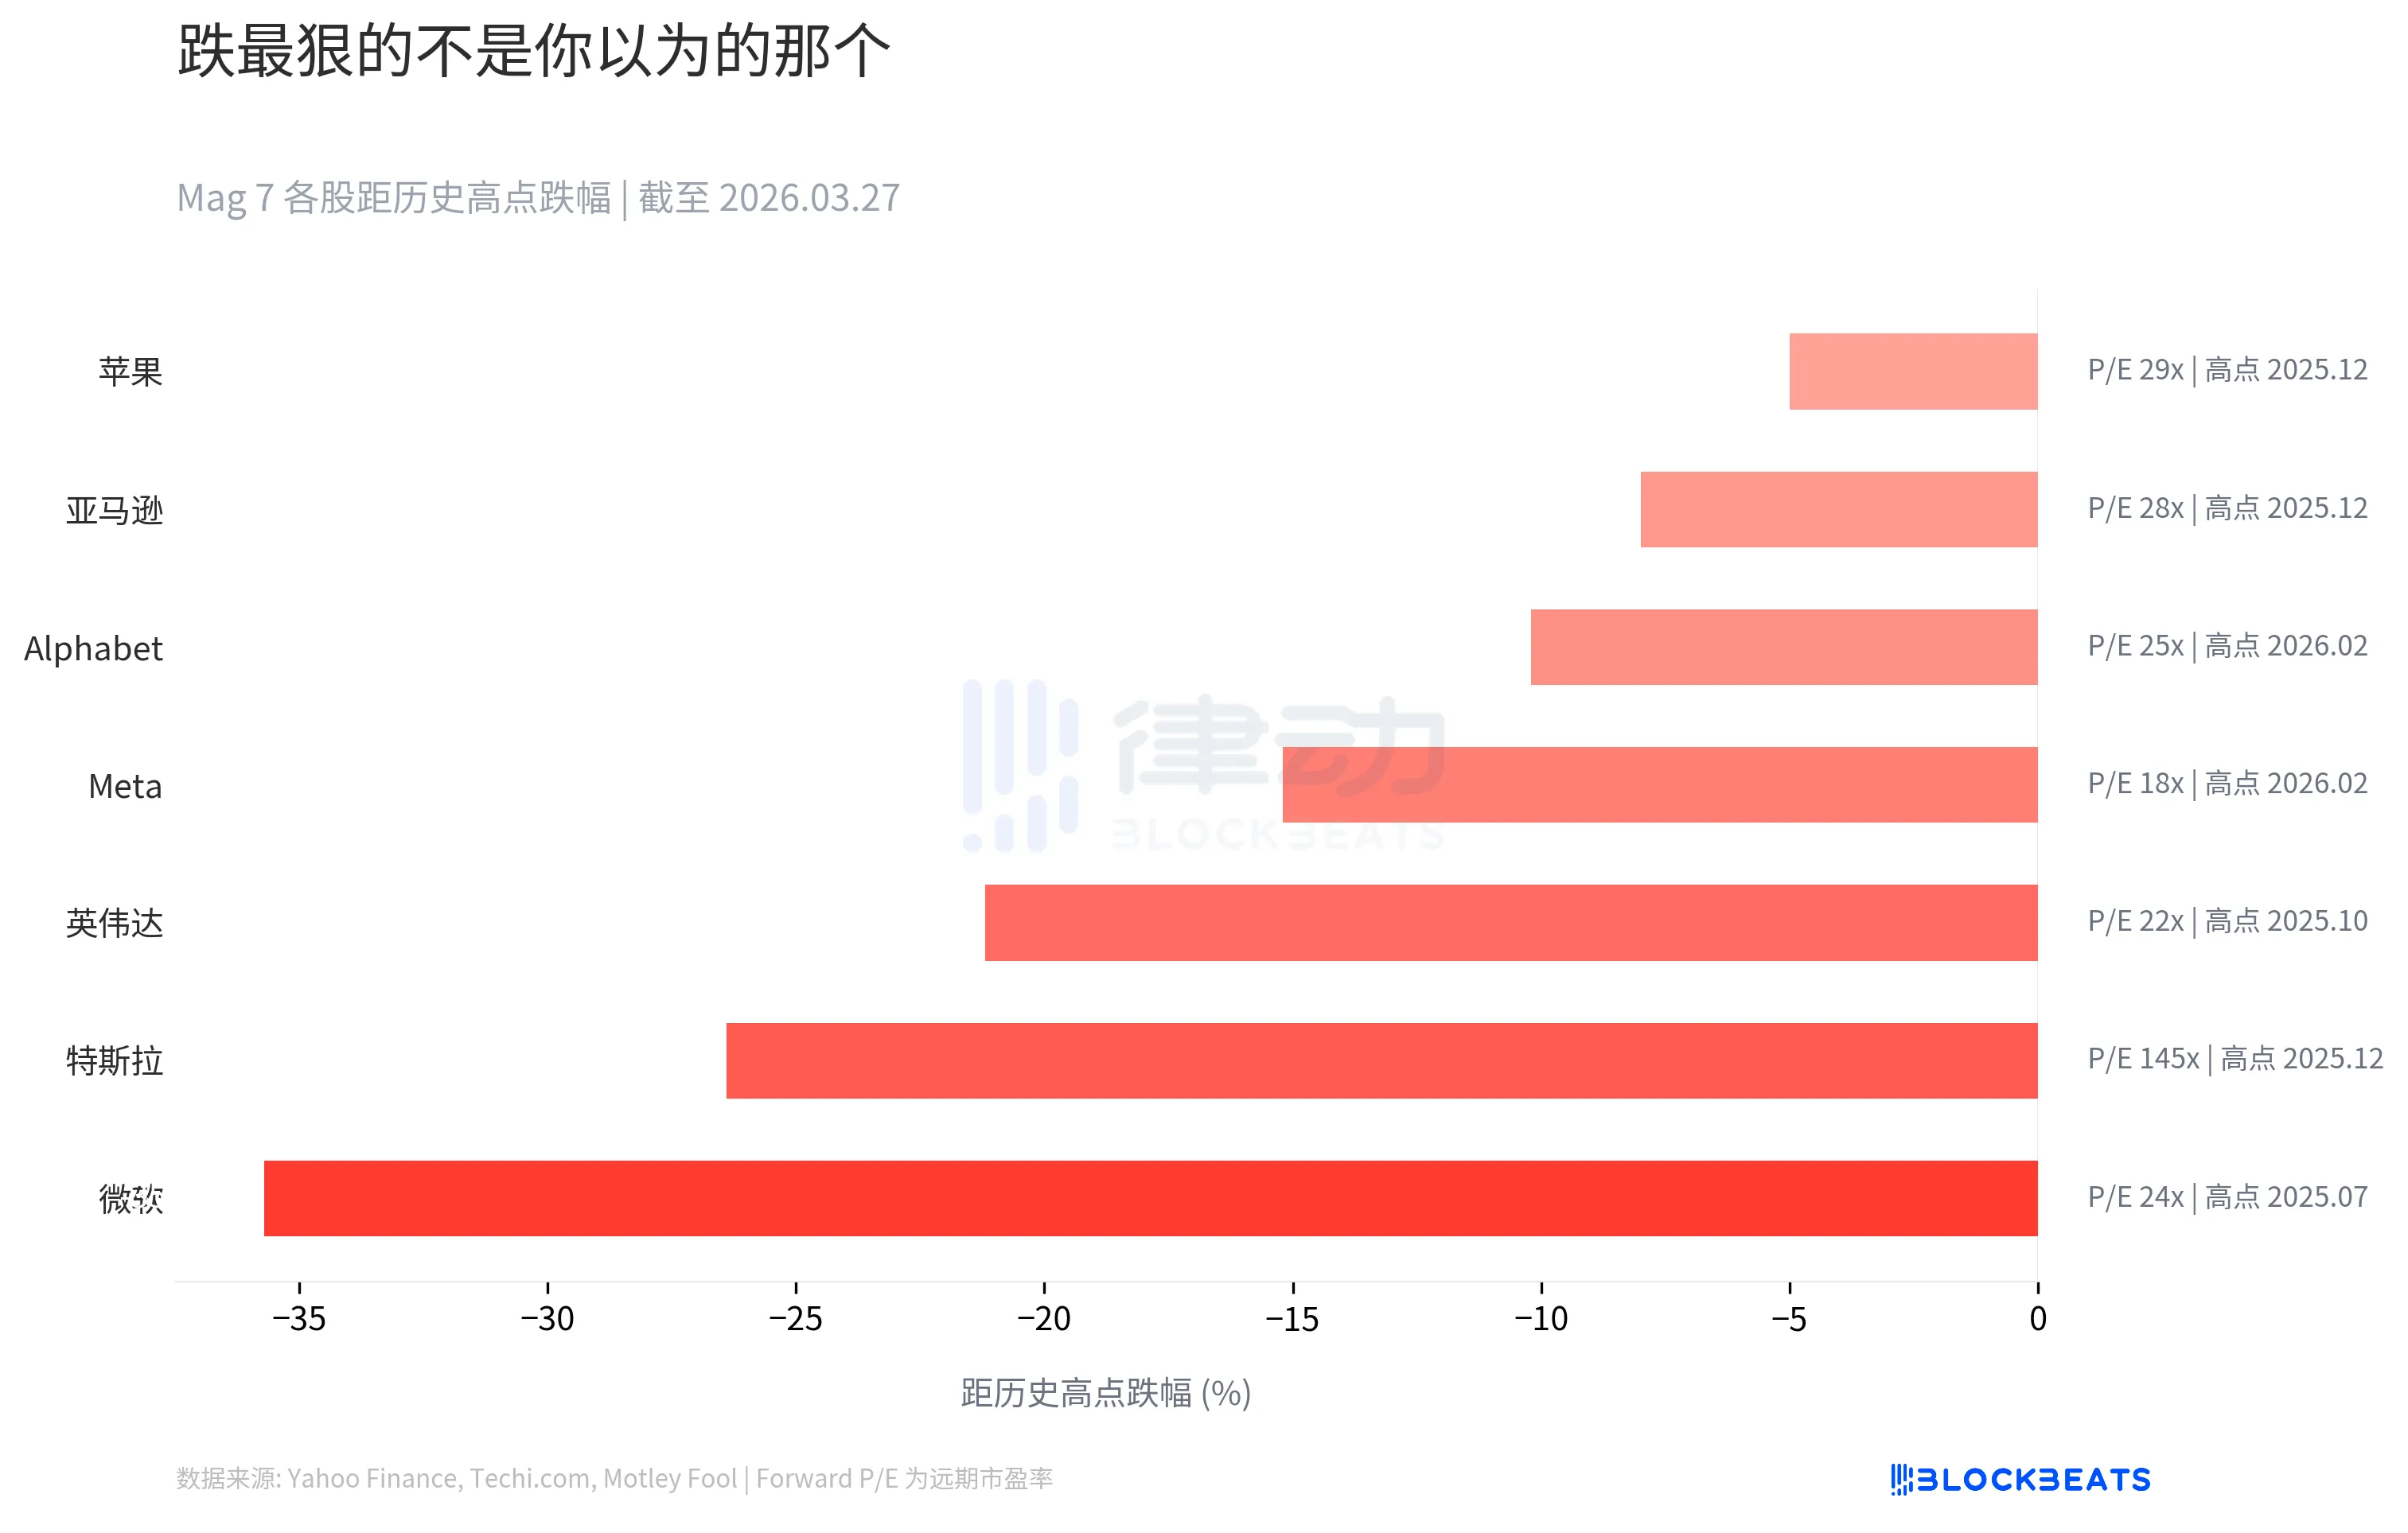
According to data from Techi.com and Motley Fool, Microsoft has dropped by 35.7% from its July 2025 peak (around $534), making it the largest percentage drop among the Mag 7 from their historical highs. Tesla ranks second with 26.4%, and Nvidia ranks third with 21.2%.
Looking at the Forward P/E column on the right, the story becomes more complex. Tesla's forward P/E is 145 times, while Microsoft's is only 24 times. Microsoft dropped more because the market priced in its expectations more rigidly. When the overall environment deteriorates, the "certainty premium" actually contracts the most.
Apple is the most resistant to decline among the seven, only falling 5% from its peak. But with a Forward P/E of 29 times, this "safety" is not cheap.
$650 Billion AI Capital Expenditure: Burning Money Is Not the Issue, It's Return Expectations
In 2026, the Mag 7 wrote themselves an unprecedented check.
According to the Q4 2025 financial guidance of each company and data compiled by Bloomberg, the 2026 AI capital expenditure budgets of the four companies Amazon, Google, Microsoft, and Meta total approximately $650 billion, a 67% increase from 2025's $381 billion. Each company's budget this year is close to or exceeds the sum of the past three years.
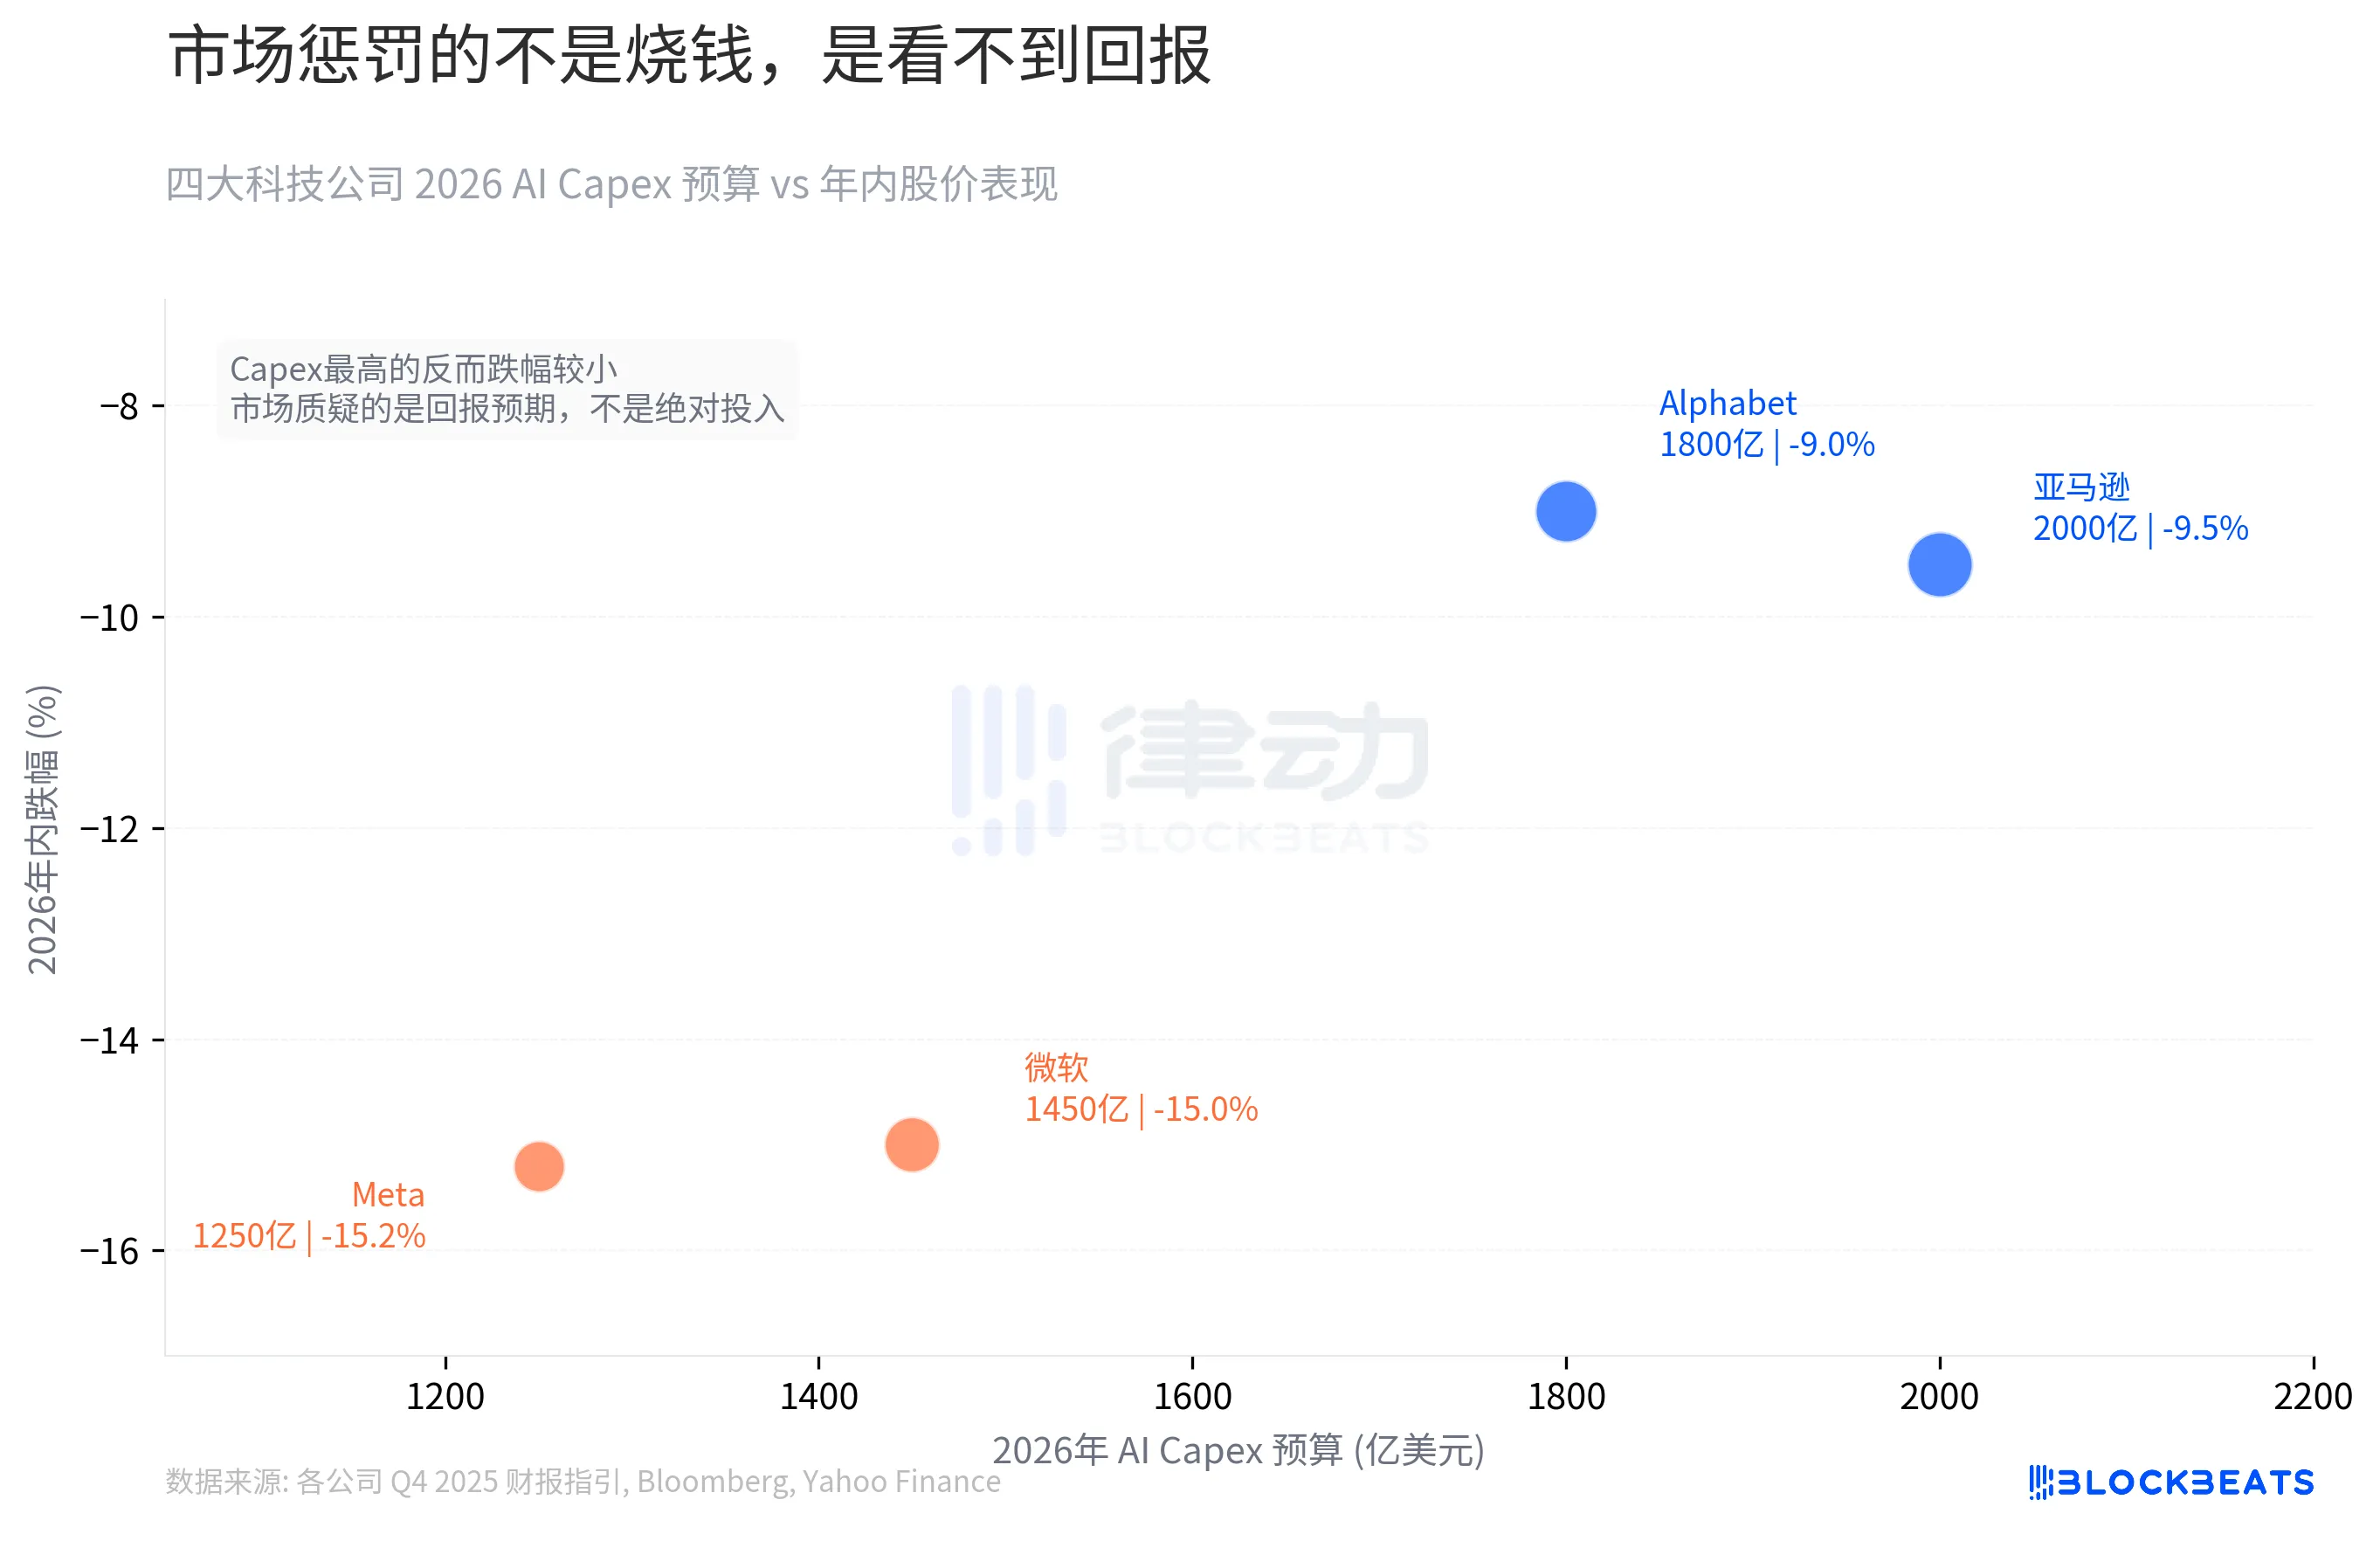
Amazon, with the largest Capex of $200 billion, and Google, with $180 billion, only dropped by 9.5% and 9% during the year. On the other hand, Microsoft with $145 billion and Meta with $125 billion in Capex saw drops of 15% and 15.2%, despite lower Capex. Spending more results in less drop.
The market's punishment is not based on the absolute scale of investment but on the visibility of returns. Amazon's AI investment directly serves its cash flow engine, AWS, and Google's investment has a clear monetization path through search advertising. Where Microsoft's and Meta's AI expenditures land is still a guessing game for investors. From Copilot's enterprise penetration to the metaverse's strategic shift to AI agents, none of these have yet materialized into numbers. The interest rate hike cycle doesn't wait for the story to unfold.
The Money Has Spoken by Walking
According to State Street Global Advisors' monthly fund flow data, year-to-date 2026, ETF net inflows into cyclical sectors such as Energy, Materials, and Industrials have reached $19 billion, accounting for 65% of all sector ETF inflows, far exceeding these sectors' 47% market weight. According to Morningstar data, Natural Resources funds saw $7.5 billion in inflows in January, marking a sector's monthly historical high.
According to ETF Trends data, cyclical sectors have seen an average year-to-date gain of +20%, while the Technology sector is down 6% year-to-date, and the S&P 500 as a whole is up only +0.5%. The Aerospace & Defense ETF (SHLD) saw over $10 billion in net inflows in January, with a year-to-date gain of +20%. The Technology sector is not entirely bleeding out, with $6 billion in inflows in February, but the returns significantly lag behind cyclical sectors.
With interest rate expectations flipped, the $650 billion in AI spending has become the most prominent line on the balance sheet. Institutional money has started to move, heading towards Energy and Defense.
EY-Parthenon Chief Economist Gregory Daco has referred to the current situation as "multidimensional disruption." He puts the probability of a U.S. recession at 40%. Goldman Sachs at 30%, while Moody's Chief Economist Mark Zandi's number is close to 50%.
Three years of exuberance, three months of reversal, and $650 billion hanging in the balance of a tightening cycle. Was the $2 trillion market cap evaporation of Mag 7 a single day panic, or is the market repricing for a cycle that has already concluded?
You may also like

Bitcoin Trading Guide 2026: Strategies for Experienced Traders

What Is XAUT and PAXG? Why Tokenized Gold Is Booming in 2026

Cryptocurrency CEXs are flocking to sell US stocks, and traditional brokerages are facing an "uninvited guest."

Will the SpaceX IPO Hurt Bitcoin? Here's What Traders Are Watching
Foreign selling in the South Korean stock market accelerates, with cumulative net sales reportedly reaching $75 billion this year
On June 9, The Kobeissi Letter, citing Goldman Sachs data, reported that global investors are selling South Korean stocks at an unusually rapid pace. In the latest trading session, foreign investors sold about $801 million worth of Kospi constituent stocks again; total foreign outflows last week reached about $10 billion, and the market has been in net foreign selling on nearly every trading day over the past month. According to the data cited in the report, foreign investors have sold about $75 billion worth of South Korean stocks so far this year. Meanwhile, South Korean retail and institutional investors together recorded roughly $69 billion in net buying over the same period, suggesting that the market’s main buying support has come from domestic capital rather than returning overseas funds. The information currently disclosed still mainly comes from The Kobeissi Letter’s retelling and Goldman Sachs data summaries, while public details on the statistical period and the specific definition of “selling” remain relatively limited.

Fortune Warns of Strategy’s Financing Structure Risks as Bitcoin Premium Narrows
Fortune warned that Strategy’s Bitcoin treasury model faces growing financing risks as MSTR’s net asset premium narrows and preferred stock dividend pressure increases.

Ferrari Challenge Le Mans: Carl Moon to Dominate in WEEX Livery

Sahara AI Responds to SAHARA’s Sharp Drop: No Contract or Product Security Issues Found, Internal Investigation Underway
Sahara AI responded to SAHARA’s 60% price drop, saying no token contract or product security issues have been found and an internal investigation is underway.

WEEX Deposit/Withdrawal Dynamic Island: Your Asset Status, Always in Sight

Scaling Crypto Derivatives: The Digital Asset Infrastructure Behind High-Volume Trading
In the fast-moving digital asset ecosystem, derivatives platforms face an extreme architectural test. High-leverage futures markets demand more than just standard security—they require absolute operational precision, zero-latency matching engines, and ironclad structural scalability, all while navigating intense market volatility.
As global platforms scale to meet these demands, the industry is shifting away from rigid, monolithic setups toward a more agile, "decoupled" infrastructure philosophy.
The Blueprint for High-Volume Copy TradingFor elite global exchanges like WEEX (founded in 2018), this architectural choice becomes critical when scaling high-volume retail features like social copy trading. When thousands of users automatically mirror the real-time strategies of elite traders simultaneously, it triggers sudden, monumental spikes in concurrent transactional volume.
To prevent execution latency or settlement bottlenecks during these peak volatility events, a platform's primary engine must remain entirely dedicated to risk management, copy-trade synchronization, and order matching.
The Architectural Rule: New-generation platforms must separate front-end user execution engines from heavy backend infrastructural overhead to eliminate operational friction.
By separating these layers, platforms can maintain complete sovereignty over their trading environments and user experiences while strategically aligning with institutional-grade infrastructure ecosystems. This strategic framework allows modern exchanges to leverage advanced Digital Asset Custody infrastructure such as Cobo’s behind the scenes, ensuring that backend wallet management scales elastically alongside trading spikes.
Capitalizing on Market Momentum and 400× LeverageIn a derivatives arena where platforms offer up to 400× leverage on perpetual contracts, capital efficiency and market agility are core business metrics. To capture market momentum, an exchange needs the ability to rapidly expand its asset offerings, supporting everything from legacy crypto assets to sudden, trending altcoins across a massive library of trading pairs.
Adopting a flexible, scalable Wallet-as-a-Service (WaaS) solution such as Cobo’s could completely rewrite the development timeline for high-growth exchanges. Instead of spending months of engineering capital building out custom backend wallet architectures for every new blockchain network, platforms can deploy localized infrastructure in days.
This agility allows platforms to instantly scale their listings to over a thousand trading pairs without compromising security or delaying time-to-market. It mirrors the exact operational advantages seen during high-velocity market events, similar to how advanced wallet infrastructure empowers platforms during sudden asset surges; allowing exchanges to pass that speed and liquidity directly to their global user base.
A Mature Foundation for GrowthThe synergy between trusted infrastructure ecosystems and global trading platforms represents the natural evolution of a maturing crypto market. As WEEX continues to scale its global spot and derivatives offerings for over 6 million users, adopting robust backend paradigms proves that platforms no longer have to compromise between cutting-edge trading velocity and uncompromised structural security.

Morning Report | BitMine increased its holdings by 126,971 ETH last week; trader Eugene announced his exit from the crypto market

Wang Chuan: How can one not feel anxious after the neighbor Old Wang made thirty times profit by investing in storage stocks? (Seven) - A quarter-century cycle

Get Paid to Onboard? Try WEEX’s New Homepage with Rewards for Registration, Deposit & Trade

WEEX Custom Layout: Build Your Perfect Trading Workspace in Seconds

See “Buy Walls” & “Sell Walls” Instantly: WEEX Launches the Depth Chart for Smarter Trades

What Is Quick Trade on WEEX? 2 Ways WEEX Ends Chart-Panel Jumping
Morning News | Five major virtual asset platforms in South Korea have experienced 57 incidents of hacking and system failures in six years; Grayscale submits registration application for Canton ETF
Should we escape the peak? The principle of the tail-end market in the stock market
Bitcoin Trading Guide 2026: Strategies for Experienced Traders
What Is XAUT and PAXG? Why Tokenized Gold Is Booming in 2026
Cryptocurrency CEXs are flocking to sell US stocks, and traditional brokerages are facing an "uninvited guest."
Will the SpaceX IPO Hurt Bitcoin? Here's What Traders Are Watching
Foreign selling in the South Korean stock market accelerates, with cumulative net sales reportedly reaching $75 billion this year
On June 9, The Kobeissi Letter, citing Goldman Sachs data, reported that global investors are selling South Korean stocks at an unusually rapid pace. In the latest trading session, foreign investors sold about $801 million worth of Kospi constituent stocks again; total foreign outflows last week reached about $10 billion, and the market has been in net foreign selling on nearly every trading day over the past month. According to the data cited in the report, foreign investors have sold about $75 billion worth of South Korean stocks so far this year. Meanwhile, South Korean retail and institutional investors together recorded roughly $69 billion in net buying over the same period, suggesting that the market’s main buying support has come from domestic capital rather than returning overseas funds. The information currently disclosed still mainly comes from The Kobeissi Letter’s retelling and Goldman Sachs data summaries, while public details on the statistical period and the specific definition of “selling” remain relatively limited.
Fortune Warns of Strategy’s Financing Structure Risks as Bitcoin Premium Narrows
Fortune warned that Strategy’s Bitcoin treasury model faces growing financing risks as MSTR’s net asset premium narrows and preferred stock dividend pressure increases.
